Gait Biometrics
Gait biometrics can be used in medicine, psychology and literature, in addition to the usual recognition cases. There are many databases which can be used to train models, including the Southampton database, CASIA, and HiD.
There are also different techniques that can be used, including silhouette based, and model based techniques. These are used in conjunction with viewpoint invariance extensions, and covariate studies.
Gait can be used where someone is walking in the field of view of the camera, and could be used where facial recognition wouldn't work well. The camera takes a video of the person in the frame, does some analysis, and allows us to recognise the person in the frame.
Gait
Gait is a non-contact form of biometrics, and uses sequences of images to extract the information from the individual. Unlike facial detection, or fingerprint, or iris detection, you don't need to be close to the person to recognise them. Gait is also very difficult to disguise, unlike a face which could be occluded with some sort of mask.
There are many applications of gait detection, including security and surveillance, immigration, forensics and medicine. Gait can also be used for animation or pose tracking on a subject in film and TV.
Gait works well at a distance, and when other biometrics are obscured or too low resolution to detect. Gait is even mentioned in Shakespeare's works, and lots of other literature, so it is not a new biometric.
It has been described as early as 350 BC, by Aristotle, in 1500 by Leonardo da Vinci, and from 1830-1904 by Eadweard Muybridge. In medicine, gait is also studied to see why a person is not healthy. This is normally tracked with point markers attached to a subject, then videoed to see how they walk and can thus be used as a diagnostics tool to see why a person might be suffering.
Datasets
There are three main biometrics datasets, which are not medical datasets. These are Southampton, CASIA, and HiD. There was a lab at the University to study gait biometrics.
UCSD (Early Dataset)
This was one of the early datasets, with 6 subjects doing 7 sequences. The camera used for this was a Sony Hi8 camera. The subjects walked in a circle, which could have exhausted them.
HiD (NIST Database)
HiD is short for Human ID at a Distance. This dataset involves 122 subjects, which walk between two cones. The camera is a Canon, which does progressive scan at 30 FPS. The subjects walk across different surfaces, subjects may change shoes or clothing, and carry luggage (known as covariates). This dataset was initially supported by DARPA. This was released in 2006.
Setup
The subject walks an elliptical path. There is a calibration target, and there are two cameras taking recordings at a distance of \(\approx\) 13.5 metres.
The experimental setup is portable, and is moved between different scenes to get a variation in the background.
Southampton
This dataset had around 100 subjects, using a Song TRV900E. The sample people were filmed indoors and outdoors, with most data indoors on a greenscreen background. Some data was also recorded outside with shadows and moving objects in the background, in the car park outside Building 1 and Building 16.
The data also includes covariate data for 12 of these subjects, with covariate meaning that the same subject had different clothes or shoes on, or carrying some luggage. This was released in 2002.
Setup
Subjects walk through a 'tunnel' then do a circle, then walk back the other way. The path is captured by the camera. In the outside layout, the background is much less controlled, and so this would hypothetically make it harder for a model to understand.
There are also samples set inside on a static treadmill.
Usage
The data has been used by over 300 published work, with most use from China, UK, and US (with China having the most of the three).
CASIA (B) Database
This has 124 subjects from 11 viewpoints, with different clothing and carrying conditions. This is a Chinese dataset. In their dataset, the subjects may be walking in a variety of different ways (e.g., parallel to camera, diagonally, etc.)
Setup
There are 3 to 4 cameras per computer, and 3 computers networked together. 11 cameras simultaneously record the scene. There is a calibration mask at each side of the path to be walked. The 11 views form a semicircle arc about the centre point of the path walked.
Other Datasets
The four datasets mentioned above are the main ones used for biometrics. Others include:
- The old Southampton Data
- CMU
- Wuhan
- Maryland
- MIT
- GATech
- Southampton Multibiometrics (conglomerate of face in video, gait, ear, semantics)
Techniques
With the above datasets, there are multiple ways to extract the gait and describe it. The two predominant approaches to gait recognition are silhouette descriptions, performing statistical analysis on the whole image. These can be derived with things such as PCA techniques. These techniques utilise symmetry (temporal), moments (velocity), or silhouettes (unwrapped).
The second approach, which is much less common, is model based techniques. This is a more challenging approach to implement, but can be more powerful than the first technique. Model-based techniques work on a part of the image, e.g., the legs, to extract data.
For example, we can model the legs as pendulums, with either two points, or three points (including the knee). Techniques can involve coupled and forced oscillator. Some techniques also use an anatomically guided skeleton to extract the information for classification.
Velocity Moments
Velocity moments are an extension of normal moments but also uses the velocity of each pixel as the person walks in front of the camera. This means that we need to have multiple frames of the person for this to work.
We first do background subtraction on the image sequence, then compute the velocity moment with the following equation:
Here, \(U\) is proportional to the speed of the pixel in the \(x,y\) directions. We use \(v_x\) to denote the speed of the pixel in the \(x\) direction, and \(v_y\) for the \(y\) direction. The function \(U\) takes the parameters \(i,\mu,\gamma\), where \(\mu,\gamma\) are the order of the moment. The function \(U\) is proportional to the velocity at order \(\mu,\gamma\), which in turn is proportional to the velocity:
\(S(m,n)\) is the centralised moment, and \(P_{i_{x,y}}\) is the pixel greyscale value at \((x,y)\) for image \(i\).
For each person, we take e.g., three moments (typically more), then plot them on a graph. If we have a person who is walking naturally, then these features will be close. If a person attempts to change their walking pattern, then the features will change significantly. The feature space map for the original walking is given below, followed by the feature space map including the funny walking:
Normal:
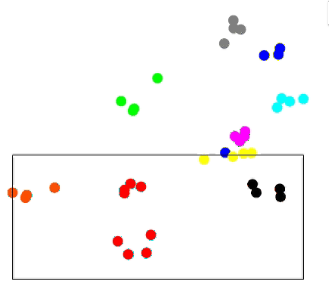
Funny:

Average Silhouette
This is the most popular technique and involves calculating the average silhouette from their full gait cycle. Again, to do this, we require multiple frames of the person walking.
The average silhouette is also known as the gait energy image, or differently we can use the gait entropy image, which shows the entropy as higher where the changes are higher. Both the gait energy image and the gait entropy image have the same information, just encoded in a slightly different way.
With this image, we can then use deep learning (e.g., Liu, Zhang, Ma and Li Neuroinformatic 2018). The network used is a simple CNN which is trained on a bunch of different average silhouettes. This method has been used on the HiD, Soton, and Casia databases.
Calculating
To calculate the silhouette, we first have to perform background subtraction. The easiest way to do this is the median filtering in the temporal dimension. Another approach was to model the background with mixture of Gaussians. Regardless of the technique chosen, we will end up with the silhouette of the person.
Given the silhouette, we then have to normalise them by height. This accounts for the distance from the camera to the silhouette. We then take the pixel average over all the frames.
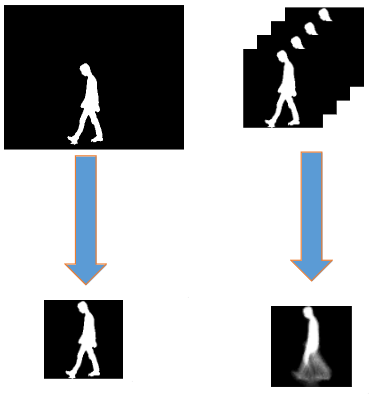
This resulting image is the average silhouette, which can be vectorized and then further processed. If using the entropy method, then we can assign each pixel a probability, then calculate the entropy. Once we have the entropy, then we realise that everywhere the person doesn't go at all, we have zero values, and in the centre of the image, which doesn't change either then we also have zero.
HiD Analysis
Within HiD, we have different experiments. For experiment \(A\), they use 122 subjects from views \((G, A, L, NB, M/N)\). There are 12 different experiments that were carried out with the different experimental setups:

Within the paper, they have a technique to estimate the recognition rate from the dataset. The way this was done was to compute the silhouette (background subtraction and further processing). Following this, they also detect the gait period (the number of frames to complete a full gait cycle).
Following this, they will partition the dataset into a probe and a gallery subsequence. These are disjoint sets, such that \(P \cap G = \emptyset\). A subsequence is a set of frames comprising a full gait cycle.
To measure similarity, we take two silhouettes. We have a function:
Between sequences, we have the sum over \(C_{kl}\):
\(j\) is the sequence index for the gallery, and \(l\) and \(k\) are the sub-sequences. This is called the correlation between the two sequences.
Similarity is the median of the maximum correlation between gallery and probe sequences.
We do this because the intersection is the area that the shapes have the same pixels, and the union is the total area of both shapes, which is a normalising factor so that pictures with more pixels total doesn't have a higher number than pictures with fewer pixels total.
This then gives the frame similarity. Sometimes this can be called intersection over union, or IOU.
Gallery and Probe
In classification, we have a training dataset. Once trained, then the classifier is ready for classification and can be used for testing. We evaluate the classifier/system in general on these test images to see how it performs on unknown data.
In ML the split is known as training data and test data. In biometrics, the terminology for this is gallery for training, and probe for the testing data.
Performance
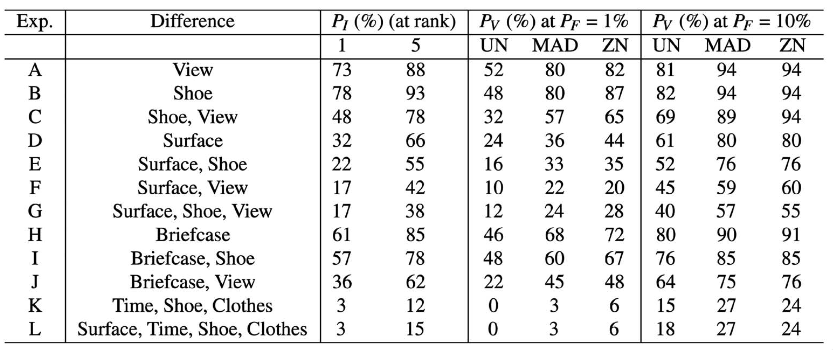
The baseline performance of each experiment is recorded in a table. The \(P_I\) gives the percentage of correct recognition. There is a second column for rank 5, which is related to the CMC.
There is then a column for the performance of verification \(P_V\), where we have a 1% tolerance, and again at 10% tolerance in the following column. The sub column then gives the accuracies in different conditions.
Cumulative Matching Curve Review
In the feature space, imagine we have 3 people. Within the feature space, each person has a set of features. For each sample of the person, we compute the centre of each group that they belong to.
If we are using a KNN algorithm, the shortest distance is very important. We compute the distance between person \(A\) and the centre of the other groups. If we are classifying \(A_1\) on the shortest distance to the classes, then we would categorise it as \(A\).
Once all samples have been classified based on the shortest distance, we might want to classify them also based on the second-shortest distance. Rank is therefore the distance index of the centre of a class within the list of closest clusters.
After classification, we then have to evaluate the data. If we have 10 samples, and one sample is incorrectly classified as the second nearest, then we have a 90% accuracy.
We can apply the same metric for different ranks, but instead of most of the samples being correct for rank 2, we would have only 10% correct, which would be because the second sample has been correctly classified but not in the right cluster, but the second right cluster.
For rank 3, given that we have now correctly classified all points (as all bar one were correctly classified initially, then the second was classified correctly but at the second distance), the accuracy would be 0%.
We can then plot the cumulative matching curve with the accuracy on the \(y\)-axis, and the rank on the \(x\)-axis. Cumulatively, at rank 2, we have 100% accuracy, whilst at rank 1 we only have a 90% accuracy. In the CMC, rank 3 would also be at 100%.
CASIA Analysis
CASIA was also analysed, but modelling the background, segmenting the motion, then tracking the person. From that, they can then extract the silhouette, perform a 2D silhouette unwrapping, then perform 1D signal normalization.
From here, we can use PCA to recognise the signals.
Silhouette Representation
Once the silhouette has been isolated from the image, the centre is found. From the centre, each pixel is given a distance from the centre, giving the distance from the centre to the boundary. These are then normalized.
This then gives PCA a set of data to reduce the dimensions of. Other parts of the signal we can do is plot the aspect ratio of the person, take a gait signal after the background subtraction and PCA, take the autocorrelation signal, take the first derivative of the correlation, or take the positions of the peaks.
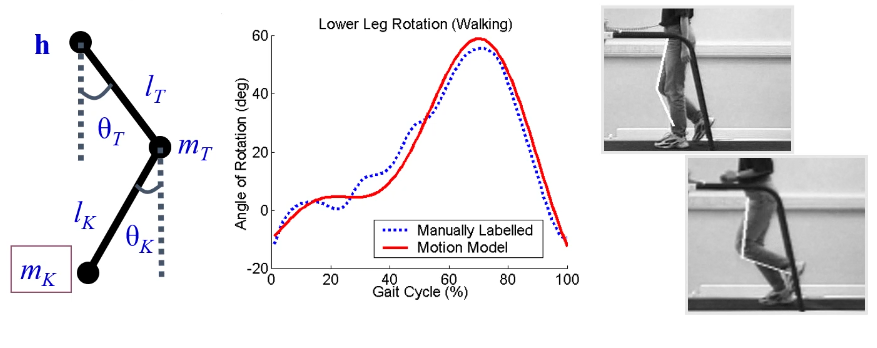
These are the features used for the classification. From here, we can then take the rank as earlier, to compute the correct classifications. We can also see the comparisons to other papers, and the cost of performing this analysis.
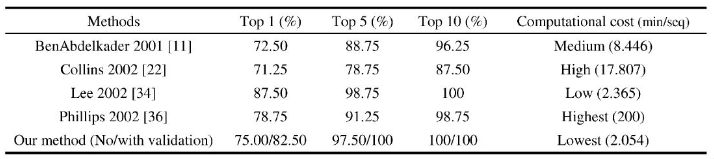
We can also plot the graph of the false accept rate on the \(y\)-axis, compared with the false reject rate on the \(x\)-axis. A line \(y=x\) is the equivalent error rate. This is known as the ROC curve, or the receiver operator characteristic curve.
This graph shows different angles. The best results come from being 90% to the person. With a person walking directly towards the camera, this is the hardest, and the error rate is much higher.
Model-based Approaches
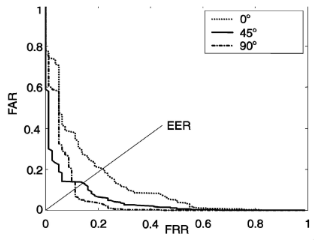
These model the human body (at least the lower part), to include the torso height, leg length, stride and overall height. We then extract features from the model.
We model the person with two legs, then measure angles. These angles include the angle of each knee (acute), and the angle between each leg at the groin (again, acute).
The problem that occurs here is that we need to detect the joints. We can then extract the angles \(\phi, \beta, \gamma\) as the features.
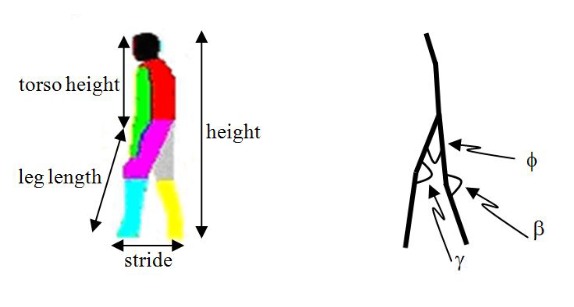
Gait can also be modelled using a pendular thigh, which is based on angles at the knee, and from the angle of the upper leg to the torso. These angles are used for the features. The next image shows the angles, the manually measured angles, then a continuous model that approximates the manually labelled points (this uses the Fourier series).
We label based on different images from the sequence of the person walking and running on the treadmill as our features:
The recognition metric is given in terms of the Fourier approximation, with the magnitude of each component at a given frequency. We can also do it based on the phase difference, or a product of the phase and the magnitude, which is a combination of both the features. These are called phase weighted magnitude (or PWM).
Confusion Matrices
We have a matrix that gives the difference between subjects. This matrix is symmetric. It gives the difference of magnitude and signature for the gaits for each different subject.
We expect for the same person that the confusion matrix is low for the same person, and very high where the person differs. What we see is that the confusion matrix between two different people is actually quite low, and that their magnitudes are broadly the same.
The signature, which is a combination of the phase and magnitude, gives a much better confusion matrix for different people, with higher confusion where the subjects differ. These can be found in Yam, Nixon and Carter, SSIAI, 2002.
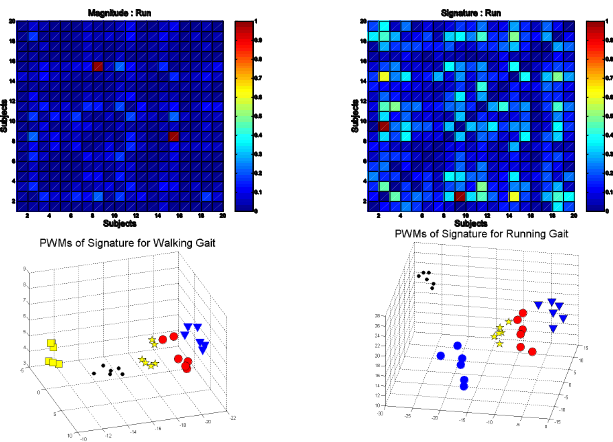
The other main thing to take away from the confusion matrices is that people's walks are much more similar to one another than their runs. Another issue we encounter is that most people spend most of the time walking, so capturing and analysing a run signature is much less likely.
Covariates
In the real world, people wear a variety of shoes and clothing, in addition to bags and other luggage. These are known as covariance factors, or covariates.
Covariates will typically have a lower accuracy on the model with the CMC (cumulative matching curve) for the data much higher for both model based approaches than silhouette based, then lower for model-based approaches that include covariate data.
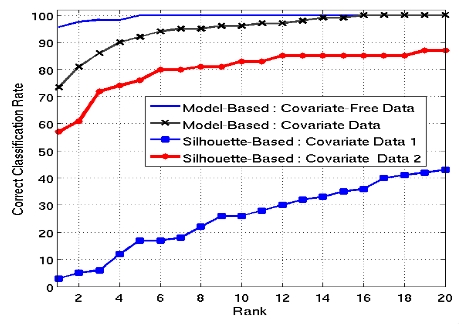
Covariate analysis can be carried out on the CMC, with the CCR and rank of data for different types of covariates.
Footwear makes a big difference, if they are wearing flip flops, trench coats are bad for clothing, and walk speed of a person also confuses things.
Viewpoint Independence
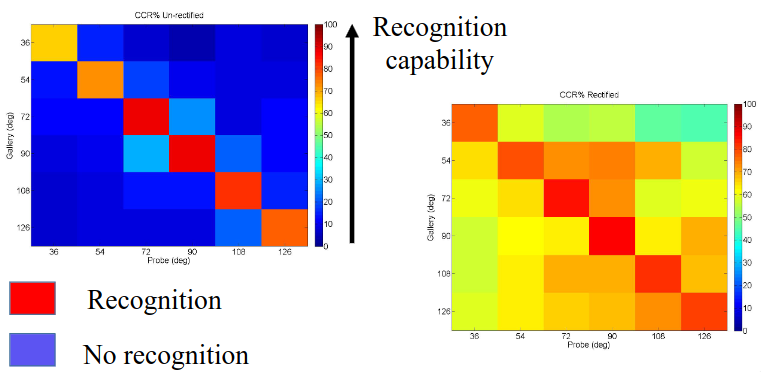
In the CASIA database, we have 12 different camera angles for each subject. When the angle between the camera and the walk is 90° then the recognition rate is very high. As the angle to the walk gets shallower, the recognition rate starts to drop off. This is because it is more challenging for the system to see the walk at a different angle.
We can therefore transform the image to skew the image such that we get an angle as clost to 90° as possible. Following this transformation, we can run the recognition and it should yield much better results.
As one would expect, if we normalize the data so it is viewpoint independent before we send it to the classifier, we will get a much better confusion matrix, as the features extracted will be the same as we correct for the skew of the data. The confusion matrices below show better recognition in red, and worse recognition in blue.
The matrix on the left is without correcting for the angle, then the matrix on the right does correct for it:
Note
The mathematics behind automatically skewing the image to make it viewpoint independent doesn't seem to be covered in the lecture, we just need to know that it is a technique that can be used.
Implementing this method is beneficial, and the authors of the paper that showed this technique made use of the CASIA dataset with viewpoint, bags, and clothing covariates.
Their data yields much higher accuracy than the silhouette-based model which doesn't rectify the data before classification.
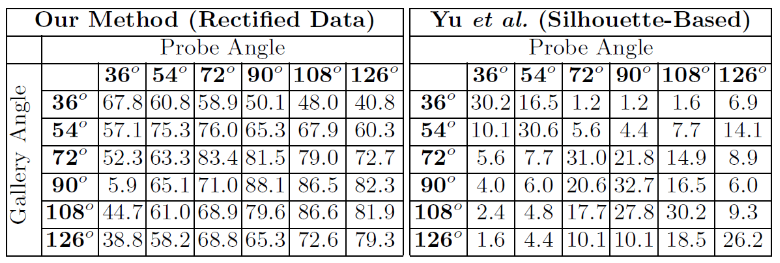
One limitation of their paper is that the automated correction is based on a known angle from the camera, and we cannot perform the correction of an angle from a random image. It is supervised because we store the angle in the training data.
Tangent? Soft Biometrics
These are useful when we have eyewitnesses. If there is a crime and there are eyewitnesses, we need to try and establish the identity of the person from the eyewitness accounts. This is normally a manual process. There is a system to automatically combine different eyewitness acounts.
In eyewitness testimony, people may describe the criminal as tall/short, slim/fat, etc. One automated system can make use of a comparative system to take an image of one person, then ask if the criminal is less/more than the person being shown. These are known as comparitive descriptions, and a ranking algorithm is used to rank the person that the eyewitness is trying to describe by their appearance.
Using this ranking, we can then construct a feature vector, which describes the criminal. This feature vector is not from an image, but from a description given by the eyewitness.
The vector can then be fused with features extracted from camera images at the location of the crime, or where the person might exist on CCTV elsewhere.
Soft biometrics allows us to classify the person based on purely a comparitive process, then uses traditional biometric features to classify that same person.
The fusion process can take distance or probability, anything that might be offered by the classifier. For SVM, we can use the distances. For random forest, we can use the probability. We can take the summation of the highest probabilities, or the minimum sum of the distances.
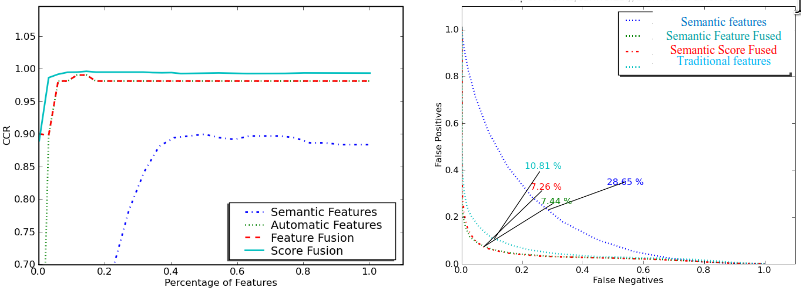
Recognition Capability
We can plot the CMC and ROC curves for purely semantic features, fused semantic features, semantic score fused, and traditional features. The graphs show that fusion performs better: